This function is used for reporting on species trends generated in indicators. It takes a vector of categories and plots then in a stacked column plot
Arguments
- species_change
factor vector of change categories. This should have the following levels "strong increase", "increase", "no change", "decrease", "strong decrease".
Examples
### Running from an array ####
set.seed(123)
# number of species
nsp = 50
# number of years
nyr = 40
#number of iterations
iter = 500
# Build a random set of data
myArray <- array(data = rnorm(n = nsp*nyr*iter,
mean = 0.5,
sd = 0.1),
dim = c(nsp, nyr, iter),
dimnames = list(paste0('SP',1:nsp),
1:nyr,
1:iter))
# Ensure values are bounded by 0 and 1
myArray[myArray > 1] <- 1
myArray[myArray < 0] <- 0
# Run the lambda_indicator method on this data
myIndicator <- lambda_indicator(myArray)
# Plot the trend stack
plot_trend_stack(myIndicator$species_change[,'category'])
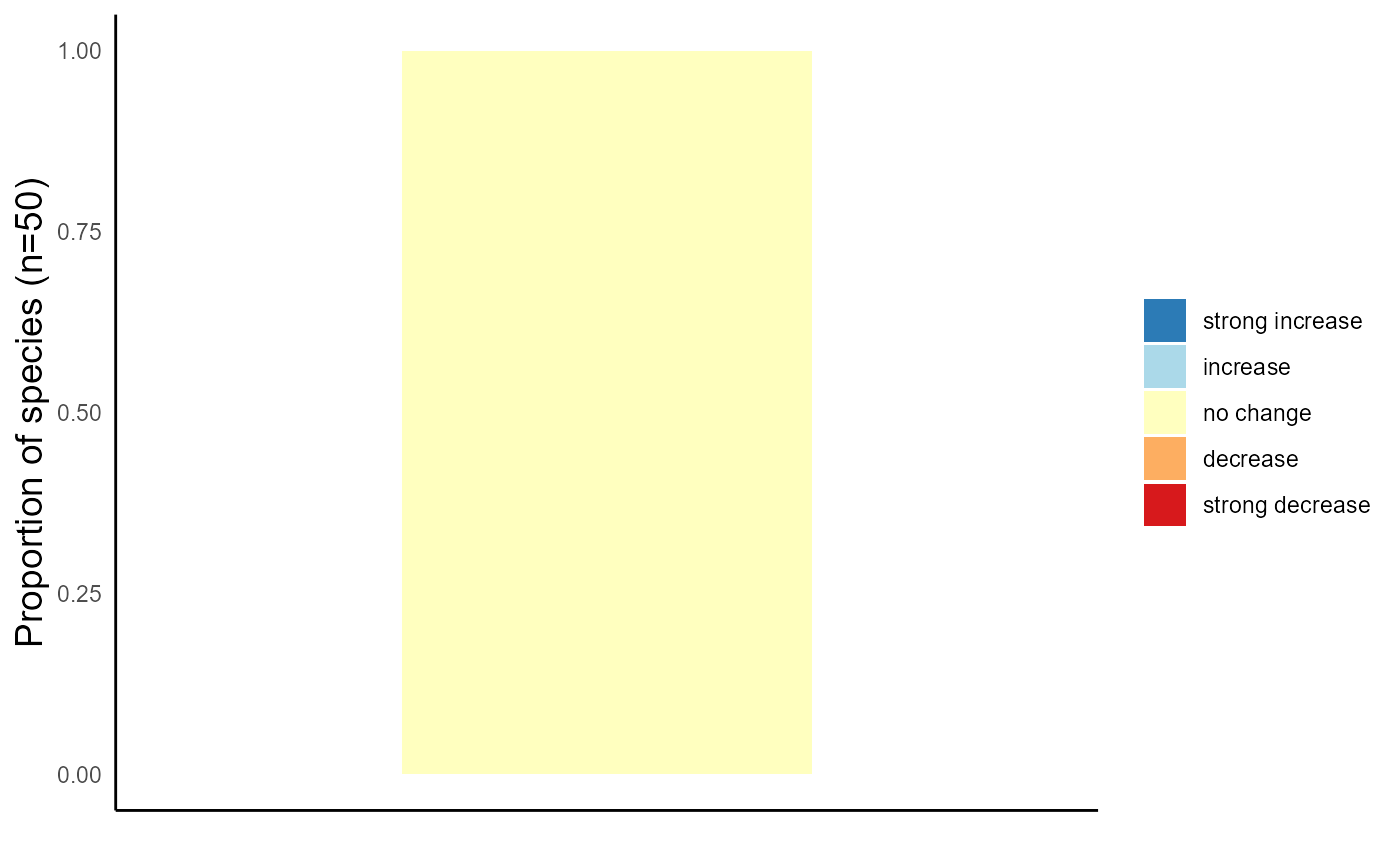 #> species_change Freq prop_spp
#> 1 strong decrease 0 0
#> 2 decrease 0 0
#> 3 no change 50 1
#> 4 increase 0 0
#> 5 strong increase 0 0
#> species_change Freq prop_spp
#> 1 strong decrease 0 0
#> 2 decrease 0 0
#> 3 no change 50 1
#> 4 increase 0 0
#> 5 strong increase 0 0